Statistics: Import PP, PE to China recovered from the previous month slump in November
Statistics: Import PP, PE to China recovered from the previous month slump in November
HD Film LD Film LL C4 Film PPBC Inj PPH Inj PPH Raf
After a reduction of 1.23-3.57% in October due to the weeklong National Day holiday, import PP and PE to China showed some recovery signs in November. In this pace, China is on its way to hit the record high level of import PP, PE arrival this year.
Some details are shown in the following table:
|
Grade |
Nov. 2018 (tons) |
M.O.M changes (tons) |
Percentage (%) |
|
|
HDPE |
554,000 |
-8,000 |
-1.42% |
|
|
LLDPE |
382,000 |
+5,000 |
+1.33% |
|
|
LDPE |
251,000 |
+8,000 |
+3.29% |
|
|
Homo-PP |
300,000 |
+13,000 |
+4.53% |
|
|
PP Copolymer |
127,000 |
- |
- |
|
|
Other PP |
16,000 |
+3,000 |
+23.08% |
|
|
Email: admin@commoplast.com |
|
|||
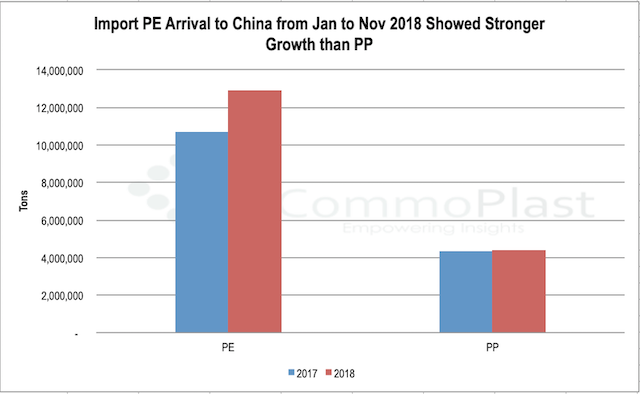
Year-on-year basis, total PE arrival to China from January to November saw 20.5% increased or 2,204,449 tons with LLDPE taking the largest portion. However, its peer – PP, only recorded a 0.93% growth in the same period. It appears that China is demanding less for PP copolymer and other PP grades from the import market while the need for regular homo-PP cargoes is still there.
It is important to note that due to the inability to separate the HS Code between LLDPE and metallocene PE (mPE), CommoPlast has combined the two grades, leading to a large increase in volume year on year.
|
China PP and PE Import January to November: 2018 vs. 2017 (tons) |
||||
|
Material |
2018 (tons) |
2017 (tons) |
Changes (tons) |
|
|
HDPE |
6,212,487 |
5,812,304 |
+400,183 |
|
|
LLDPE |
3,986,431 |
2,734,134 |
+1,252,297 |
|
|
LDPE |
2,712,045 |
2,160,076 |
+551,969 |
|
|
PPH |
2,990,900 |
2,896,064 |
+94,836 |
|
|
PP copolymers |
1,230,800 |
1,273,900 |
-43,100 |
|
|
Other PP |
153,900 |
165,100 |
-11,200 |
|
|
Total |
17,286,563 |
15,041,578 |
+2,244,985 |
|
|
Email: admin@commoplast.com |
|
|||